ESPN Stats Tools
User research / wireframes / usability testing / visual design
ConCept
Many of the projects we work on in the in-house UX team comes from a direct business need of customized software to support departments like Production, Operations, and Ad Sales to name a few. In other words, we design applications that help ESPN employees do their jobs in the easiest, most efficient way possible so that fans like you can continue to enjoy ESPN content.
For this project, I worked with a fellow designer as well as a team of Business Analysts to create a concept/design that would be expanded upon in future releases.
*To comply with my non-disclosure agreement, I have removed or distorted confidential information in this work piece. All information shared is my own and does not necessarily reflect the views of ESPN.
The Challenge
Even when you’re on-the-go and missing your favorite sports team’s big game, you can check live scores on ESPN.com, through your fantasy app, or any other ESPN platform. As a user, any information you could possibly want to know is right at your fingertips.
What you may not know is that there is an entire team of Statistic Analysts within ESPN who is working behind the scenes to make sure that the information you are getting is as up to date and accurate as possible. They use an automated live feed monitor to update data sources with game information, but when the feed goes down (loss of power supply, a random glitch), they need a way to update those scores and live information manually.
After engaging in user research and learning more about the department as a whole, we challenged ourselves to take the requirements a step further and create a system that would improve the users’ current workflow, rather than add another application to their process.
Proof of Concept Requirements
The initial requirements we received were to create a tool which would allow analysts to enter in live clock and score updates for Australian Football League (AFL) games.
The business requirements we received were as follows. As an analyst, I need to:
search for a sport/league/game to find the event I need to be watching live
provide real-time clock and score data for games
enter in the clock in a mm:ss format
edit both the home team and away team scores
submit the updates I have made
receive confirmation that my updates have been successfully posted
Although these requirements seem straight forward, we knew there was a deeper complexity in how the current Statistics tools are used.
User Research
With the basic requirements in hand, we led multiple rounds of user research to learn more about specific parts of the analysts’ workflow.
We engaged in observation sessions with over 8 users with various roles and responsibilities. In addition to learning about what they do daily, we took note of the number of applications used during a typical work day, the number of windows open at a time, and how the analysts communicate with each other.
In general, the analysts are all sports fans – passionate and knowledgeable about at least one sport. When applying for the job, many of them were required to take a ‘Sports Trivia’ test which tests their ability to recognize and remember key events that happens during games.

Multiple users captured in a persona
Pain Point 1: Work flow
Each user we talked to played a different part in a large process, but we still couldn’t see what that process looked like from a higher level. We had the puzzle pieces but needed to put them together to see what the end output of the department was.
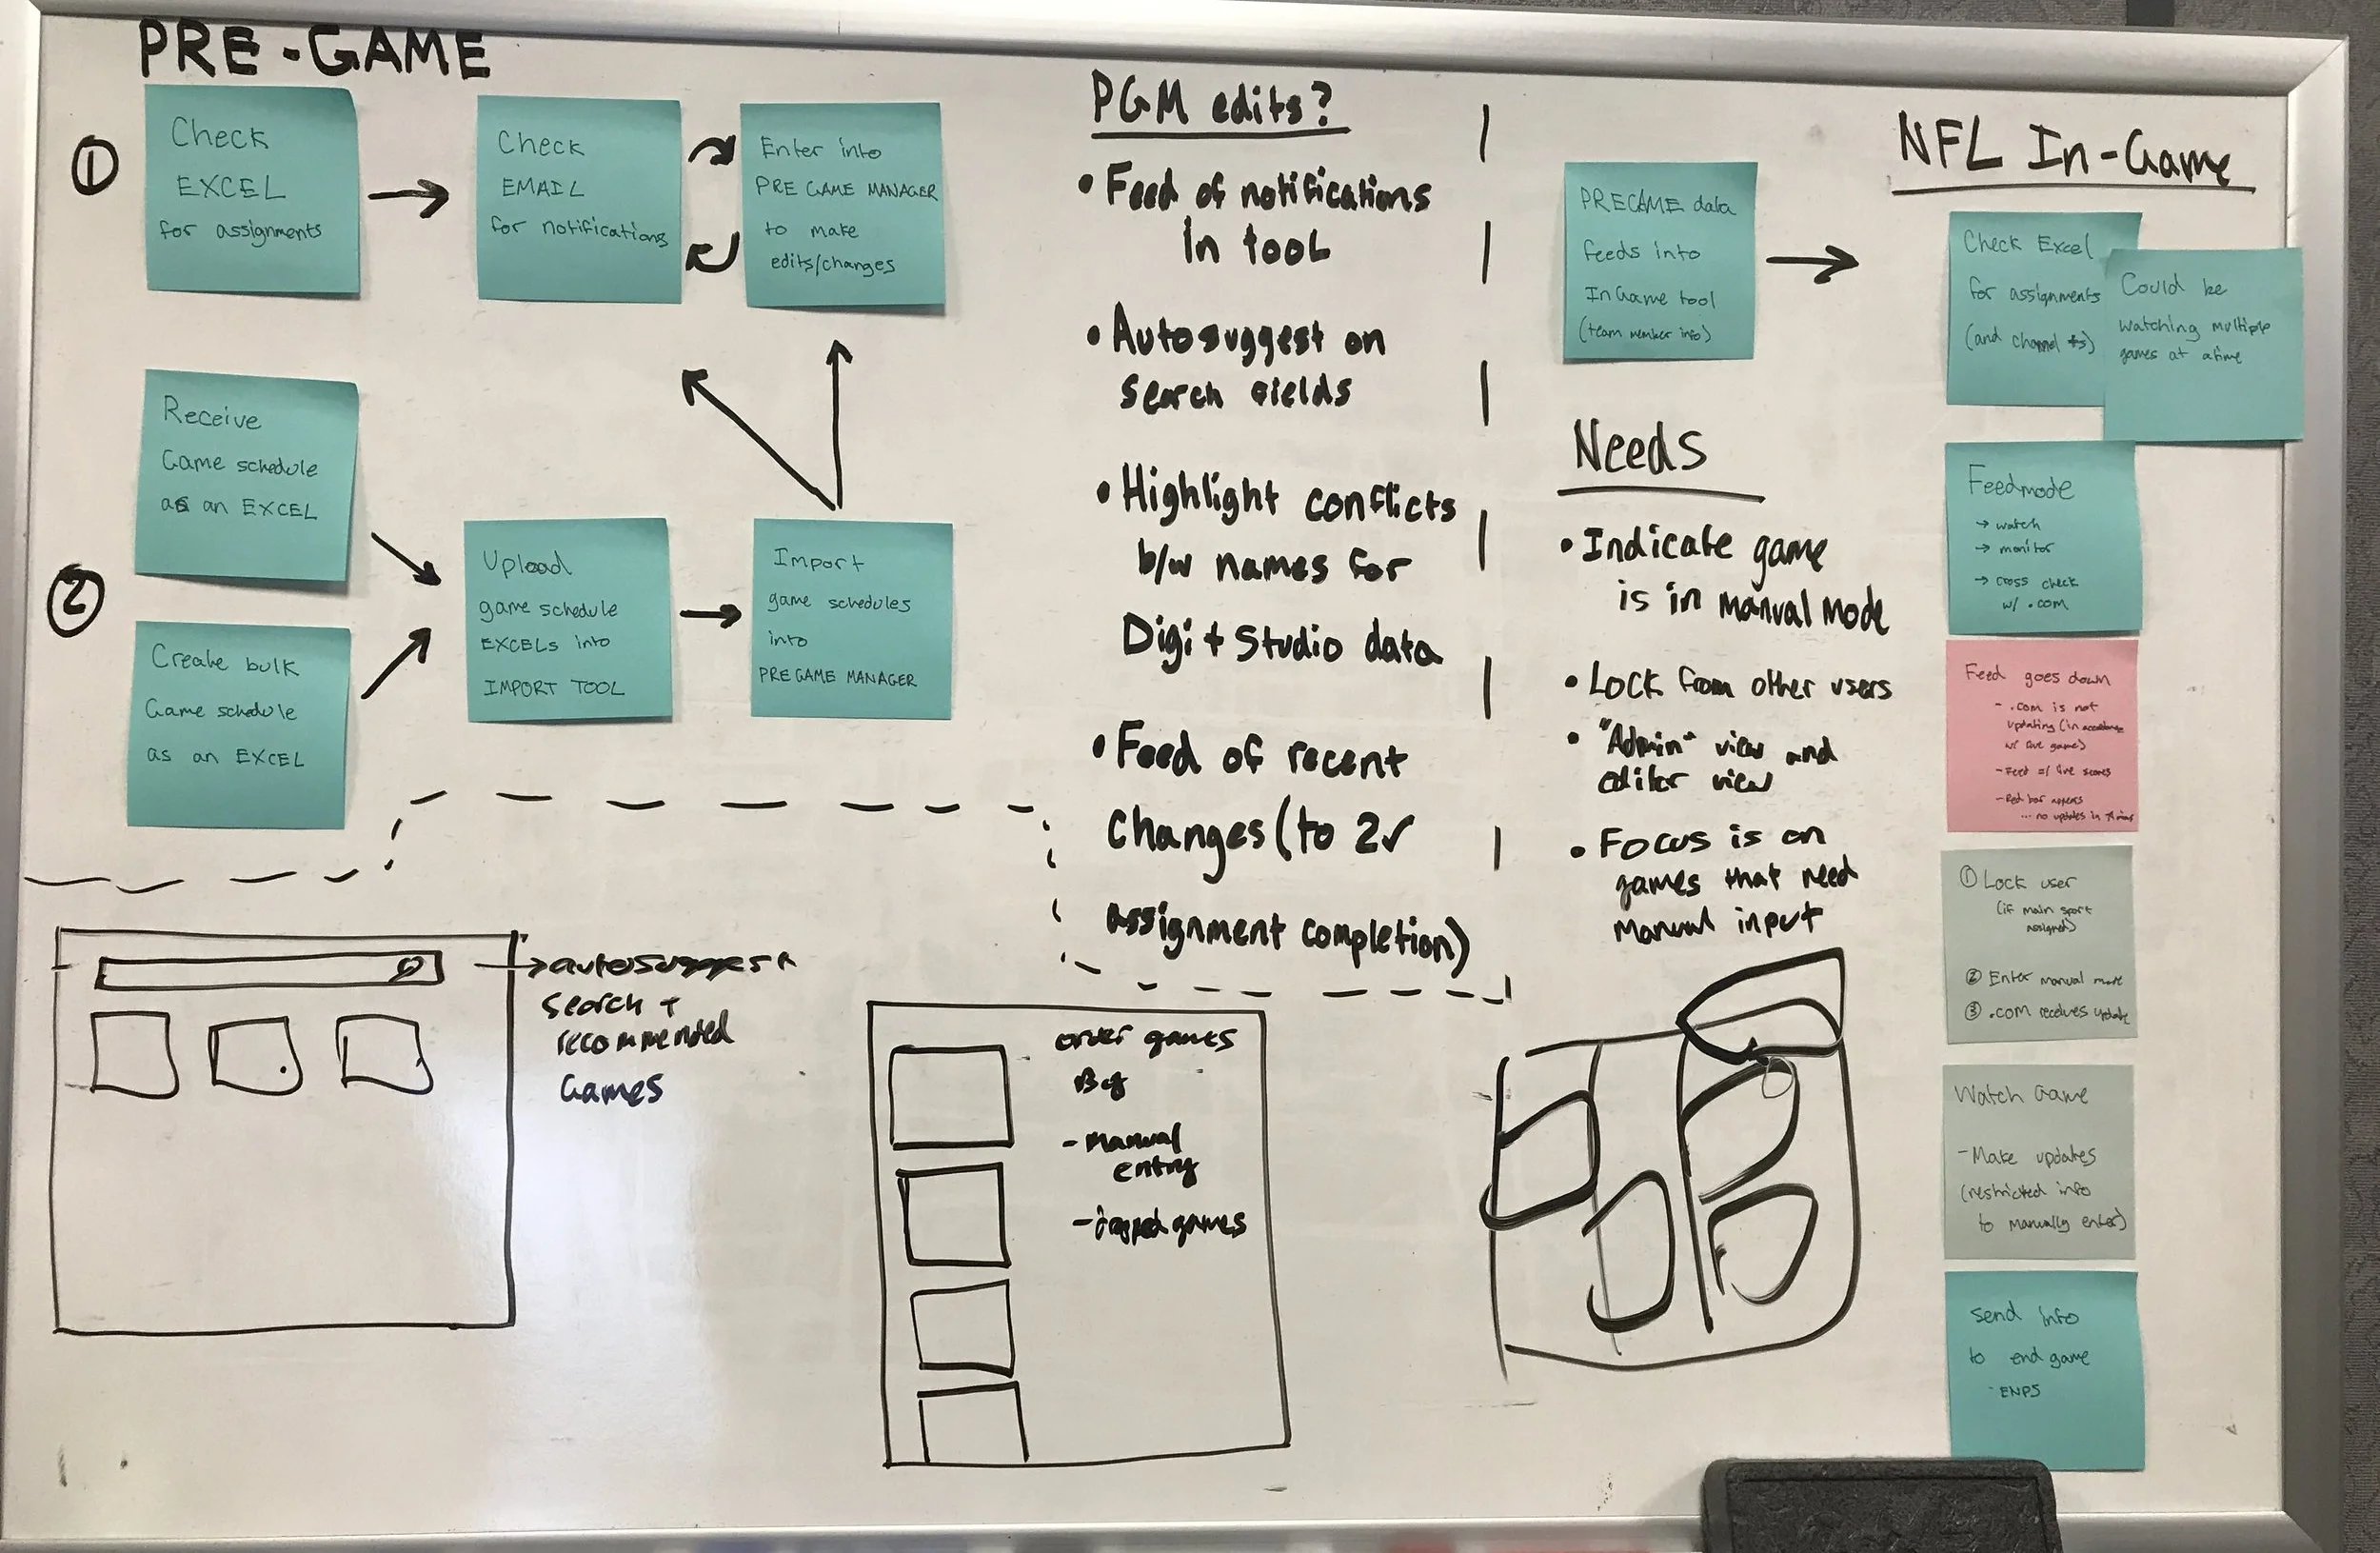
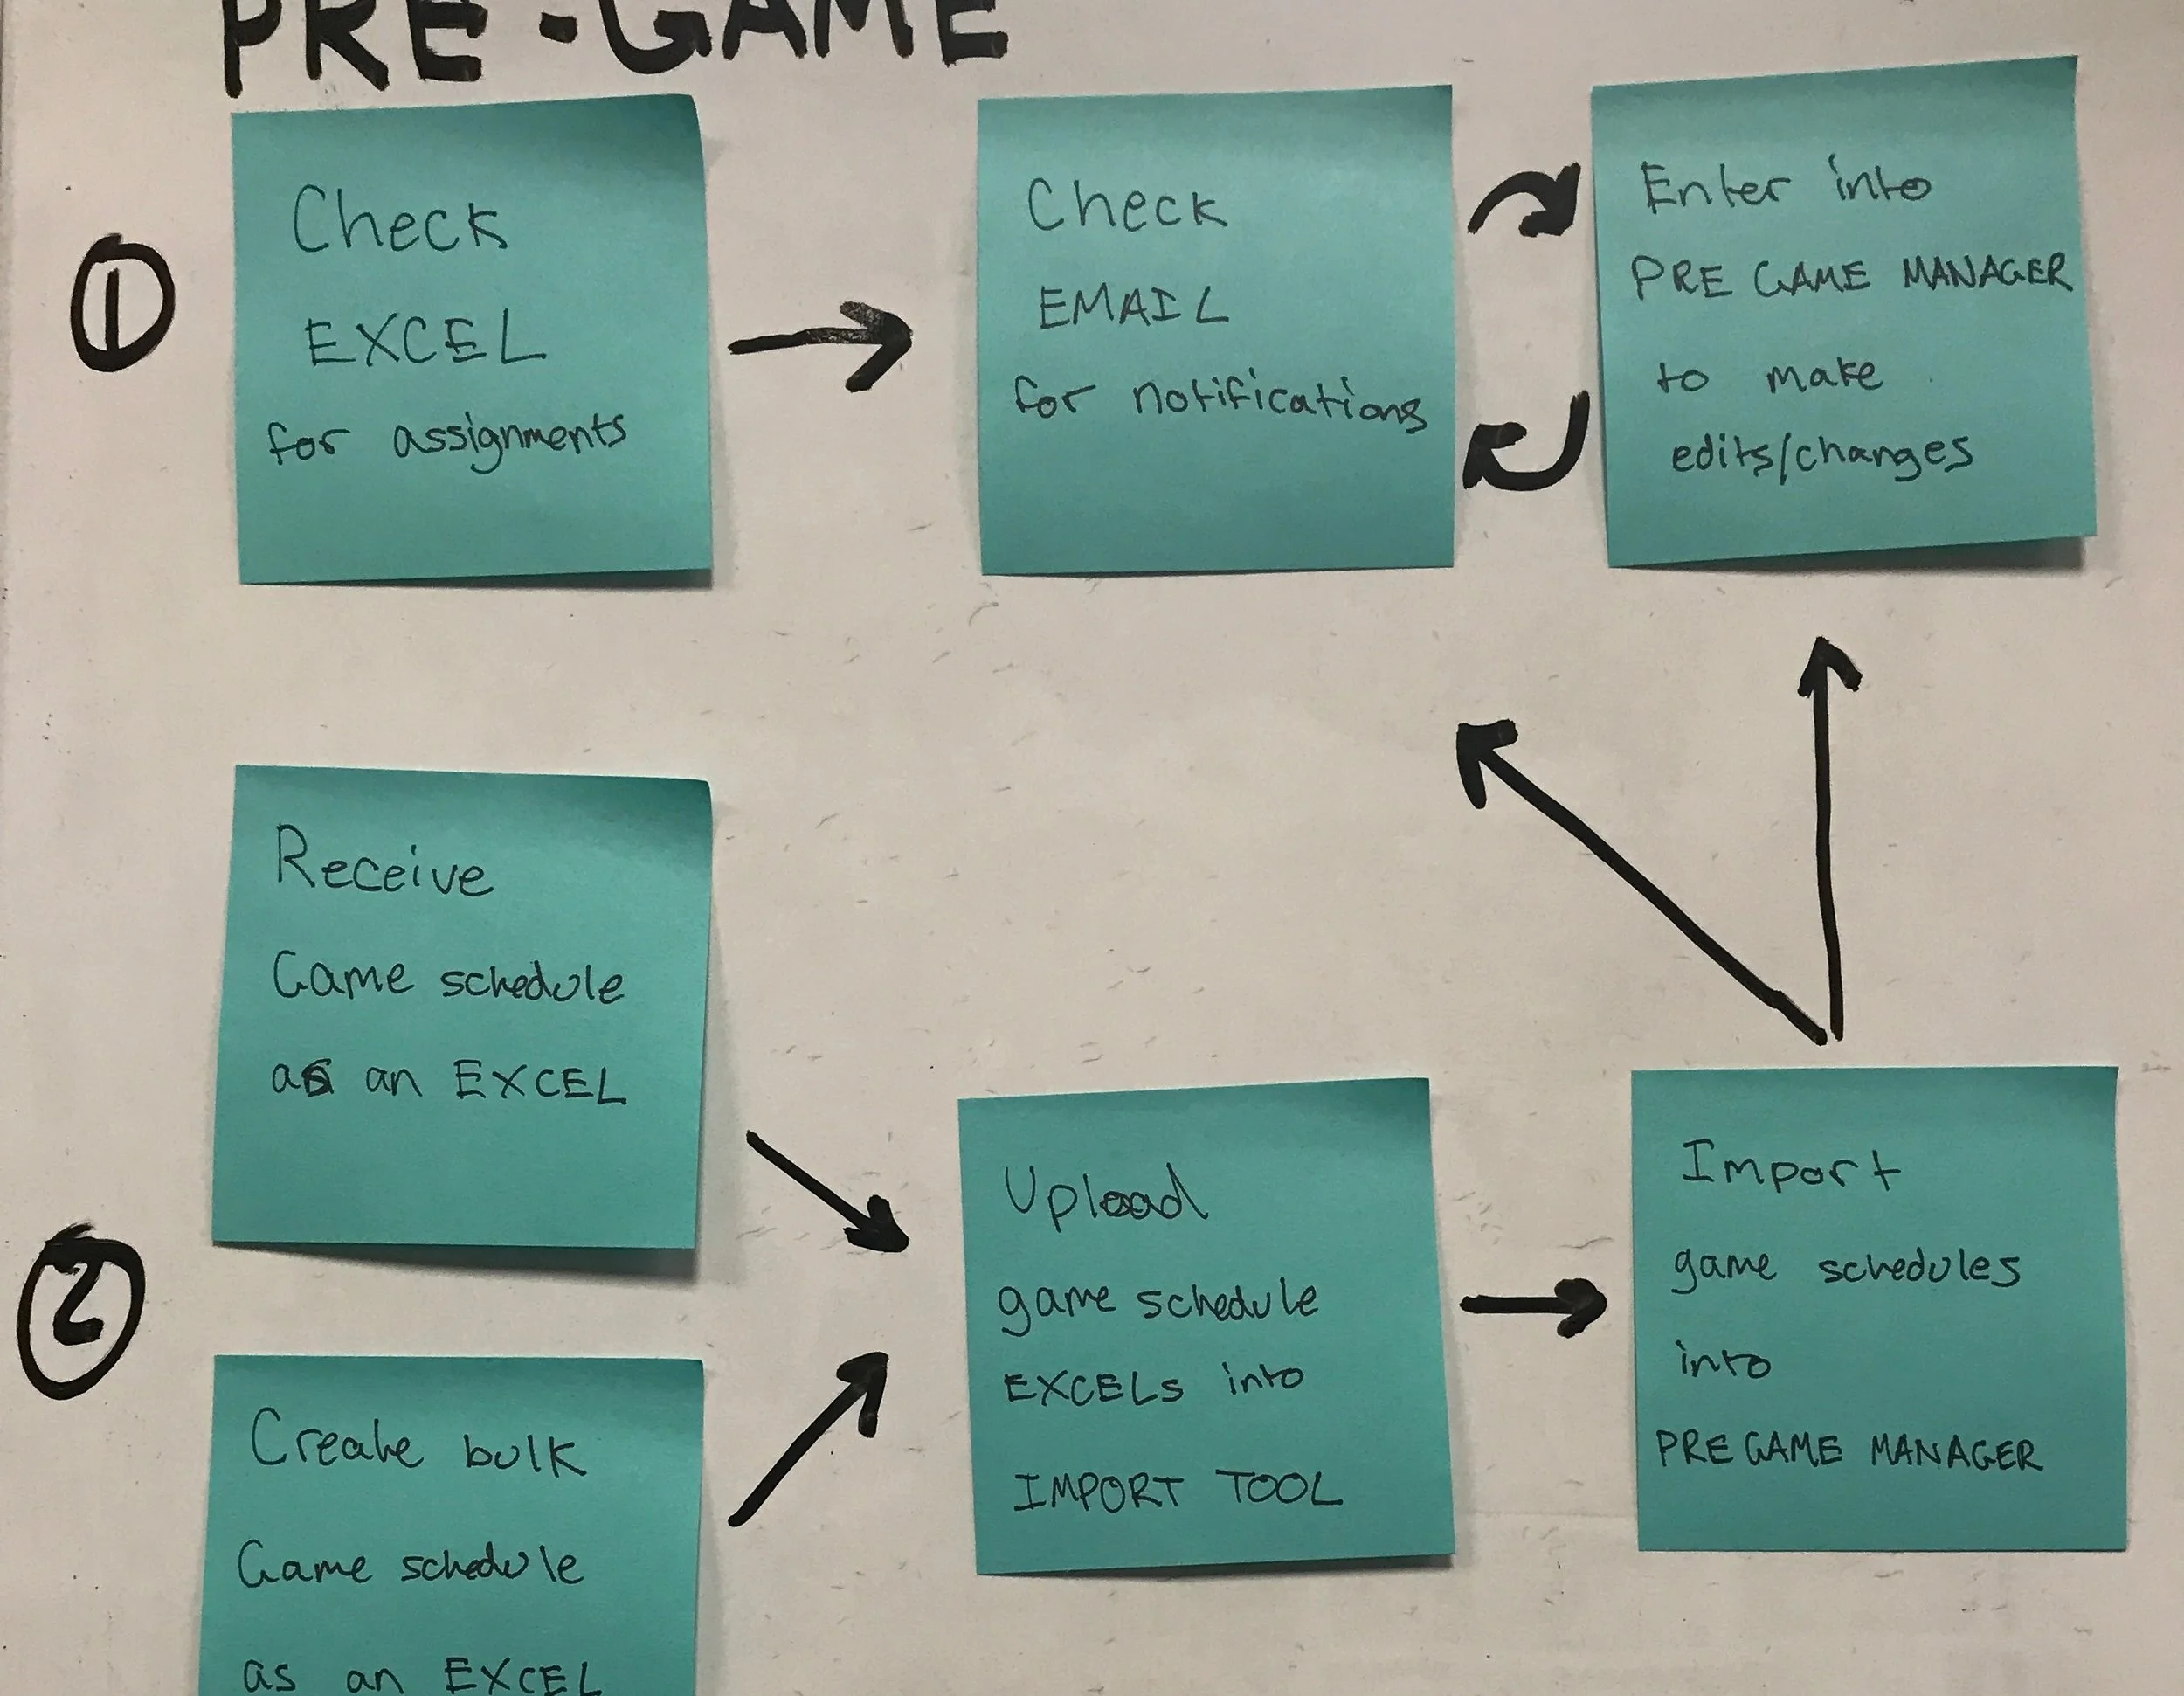
After a few sticky note sessions, we noticed there were lots of “simple” tasks with many steps. For example, a common analyst task is to update information in the (many) data sources that ESPN uses. To update a piece of information, analysts go through the following workflow:
Update: One of the stats numbers from yesterday's MLB game is incorrect
open espn.com as a reference point
make a change in DG2000 (database)
check ESPN.com to see if the change was made
send score change to Wire (historical data tracker)
open StatsTracker to change the relevant player's record
check espn.com to see if the change went through
call representative at BottomLine to notify them of the change
notify department change has been made
The analysts we observed received over 20 “update” requests in 1 hour, imagine going through the above process 20 times in addition to watching multiple live games.
Pain Point 2: Tools
Perhaps the biggest pain point we identified were the sheer number of tools, applications, and resources the analysts had to use during their work day. The process detailed above requires the analyst to go through 4 tools at least to complete the task.

List of all tools currently in use by the Statistics department

Pain point 3: Training Time
New analysts are required to go through 3 months of training to learn how to use a basic set of tools. Since the tools are sport-specific, analysts need to learn how to use different tools for every season. One user we talked to mentioned that even after working here for 5 years, they watch practice games along with new analysts so that they can remember how to use the tools for the upcoming season.
By creating a tool that requires less than a day to get used to, we could get analysts up to speed and working full-time within their first week.
The Motto: Verify Like Champions
A common theme throughout all of the observation session was the amount of times and ways information is double- and triple-checked. The information gathered and organized by analysts has a high visibility to ESPN platforms, so it is of the utmost importance that the department values accuracy. However, it’s not easy to be unfailingly accurate when you have to check 5 different data sources to see if a piece of information has been updated correctly.
Our Goals
Our overall takeaway from the user research was clear: the analysts have an important job, but they are required to use a large number of tools, applications, resources, and data sources which are complicating their workflows and adding unnecessary tasks to an already hectic day.
However, we needed to take into account the business needs and constraints, namely a short timeline and tight budget.
With that, we made it our goal to achieve the following with our design:
Reduce the number of tools required to complete daily tasks
Eliminate training time to learn how to use the tool
Increase accuracy of data by decreasing manual manipulation of data sources
Sketches and Wireframes
Navigation
To address the basic need for a clock and score tool first, we created a shell that would allow for future feature additions. With a navigation area at the top, we could add in different types of tools so that they are all accessible within the same web app.

Search screen to find and add a game to your Watch List
Watch List Side Bar
With each game being represented by a card, they can be automatically categorized as "In Play" or "Manual Mode". The users can also view high level updates of a game who has a live feed while manually updating scores for a game with a broken feed.
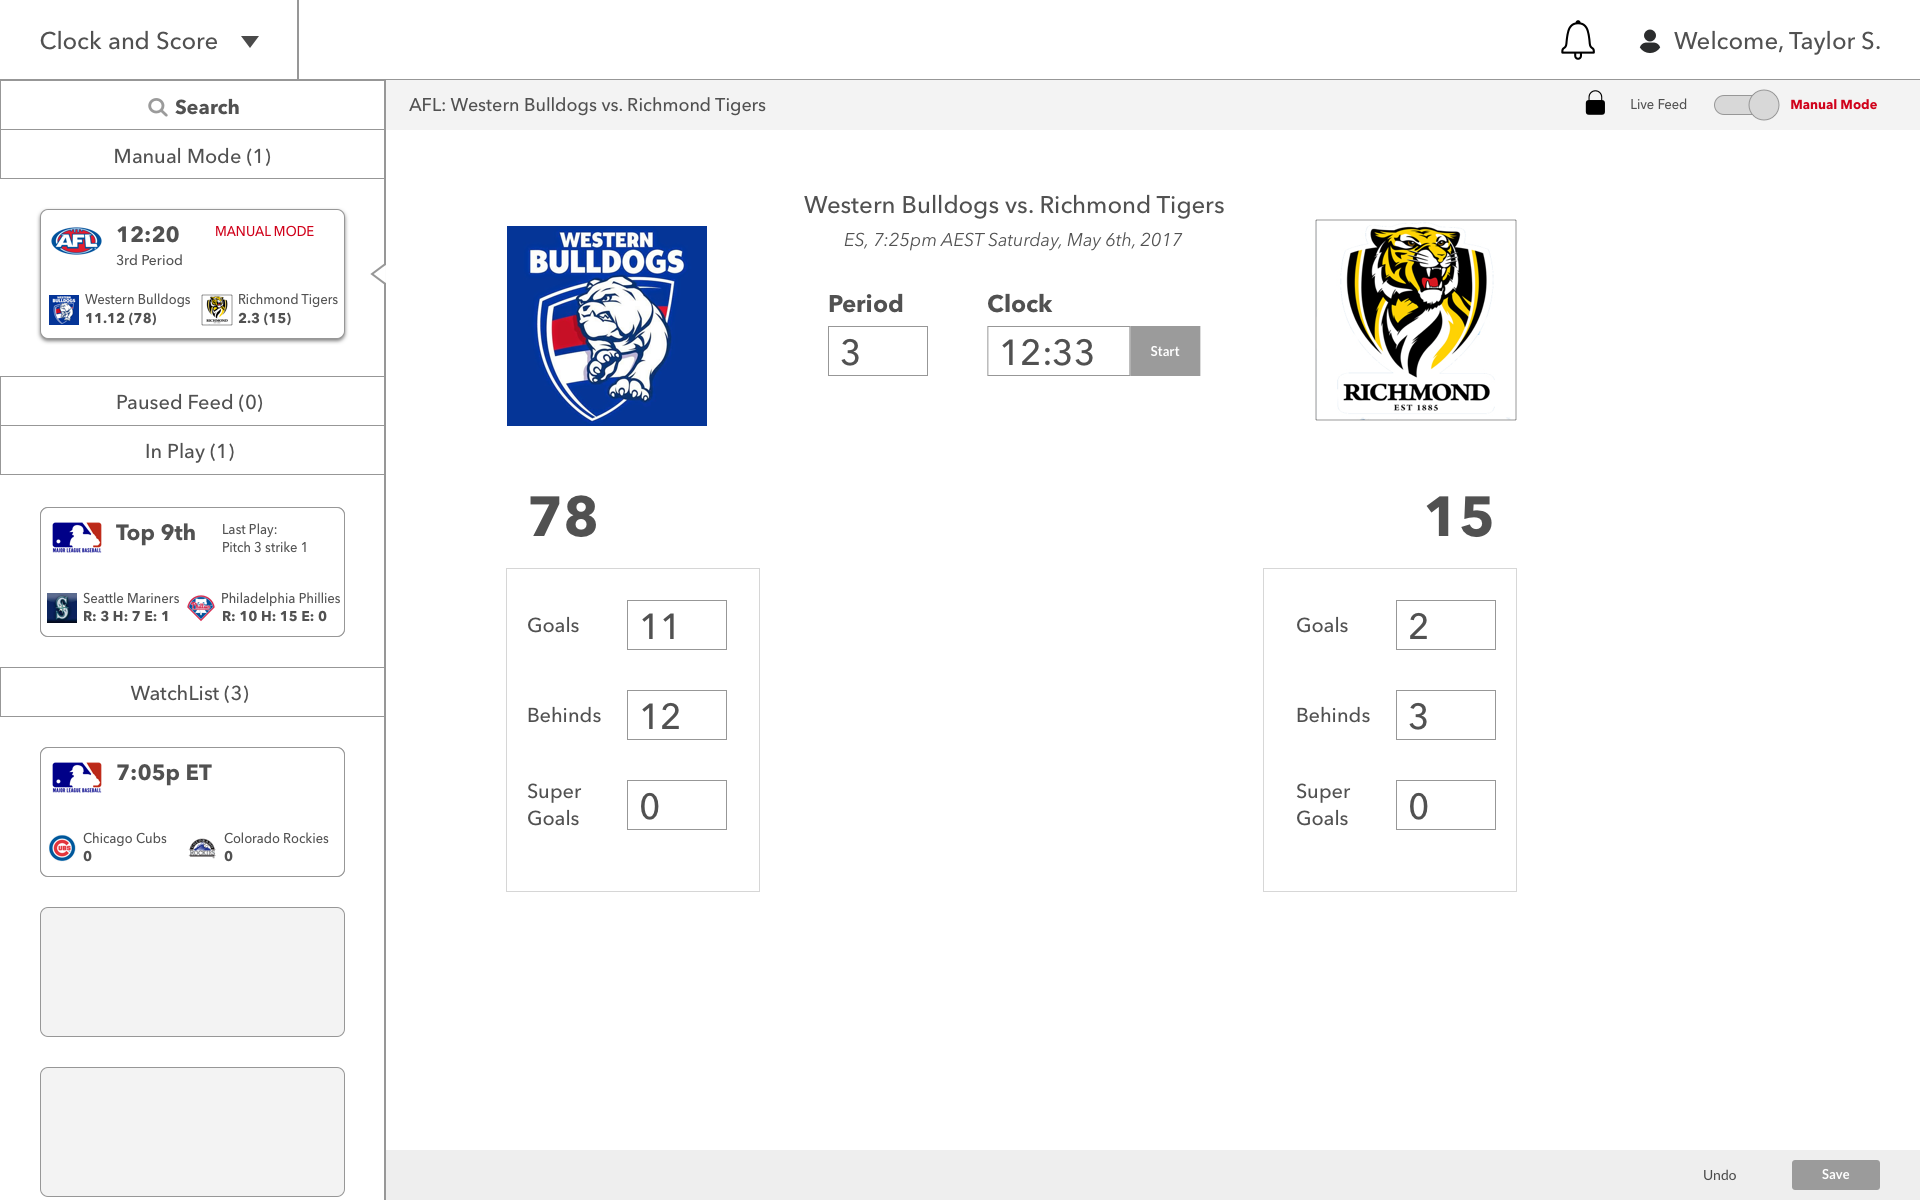
Example of Manual mode when the Game Feed is down
Usability Testing
Set-Up
With the busy and unpredictable nature of the analysts’ workday, we were lucky to secure a 1.5-hour session to test out our designs…with 5 analysts at once. As Usability Testing purists, we had some concerns. How do ensure we get honest feedback from everyone? How do we mitigate “group think” where a more passionate (louder) participant influences others’ opinions?
We chose to do a modified ‘think-aloud” method where instead of thinking out loud, after each scenario/question we asked participants to write their thoughts on a piece of paper, followed by a group discussion where they could raise questions, concerns, and answers to the questions we asked them. While we can’t say those issues were completely solved, we can say that we gave an equal opportunity to hear and observe every participant.
Findings
Our major findings included missing features, and the need to add others to each game.
4/5 participants expected the game cards to be moveable
3/5 participants expressed a need to see completed games for that day wth the ability to manually change data up to 2 hours after a game ends
5/5 participants expressed frustration around being able to assign a game to themselves, but not others (primarily a manager concern)
Final Designs

Search Screen. To assign a game to yourself, you drag the game to your Watch List. Clicking on the circles allows you to assign others if you have Manager permissions.
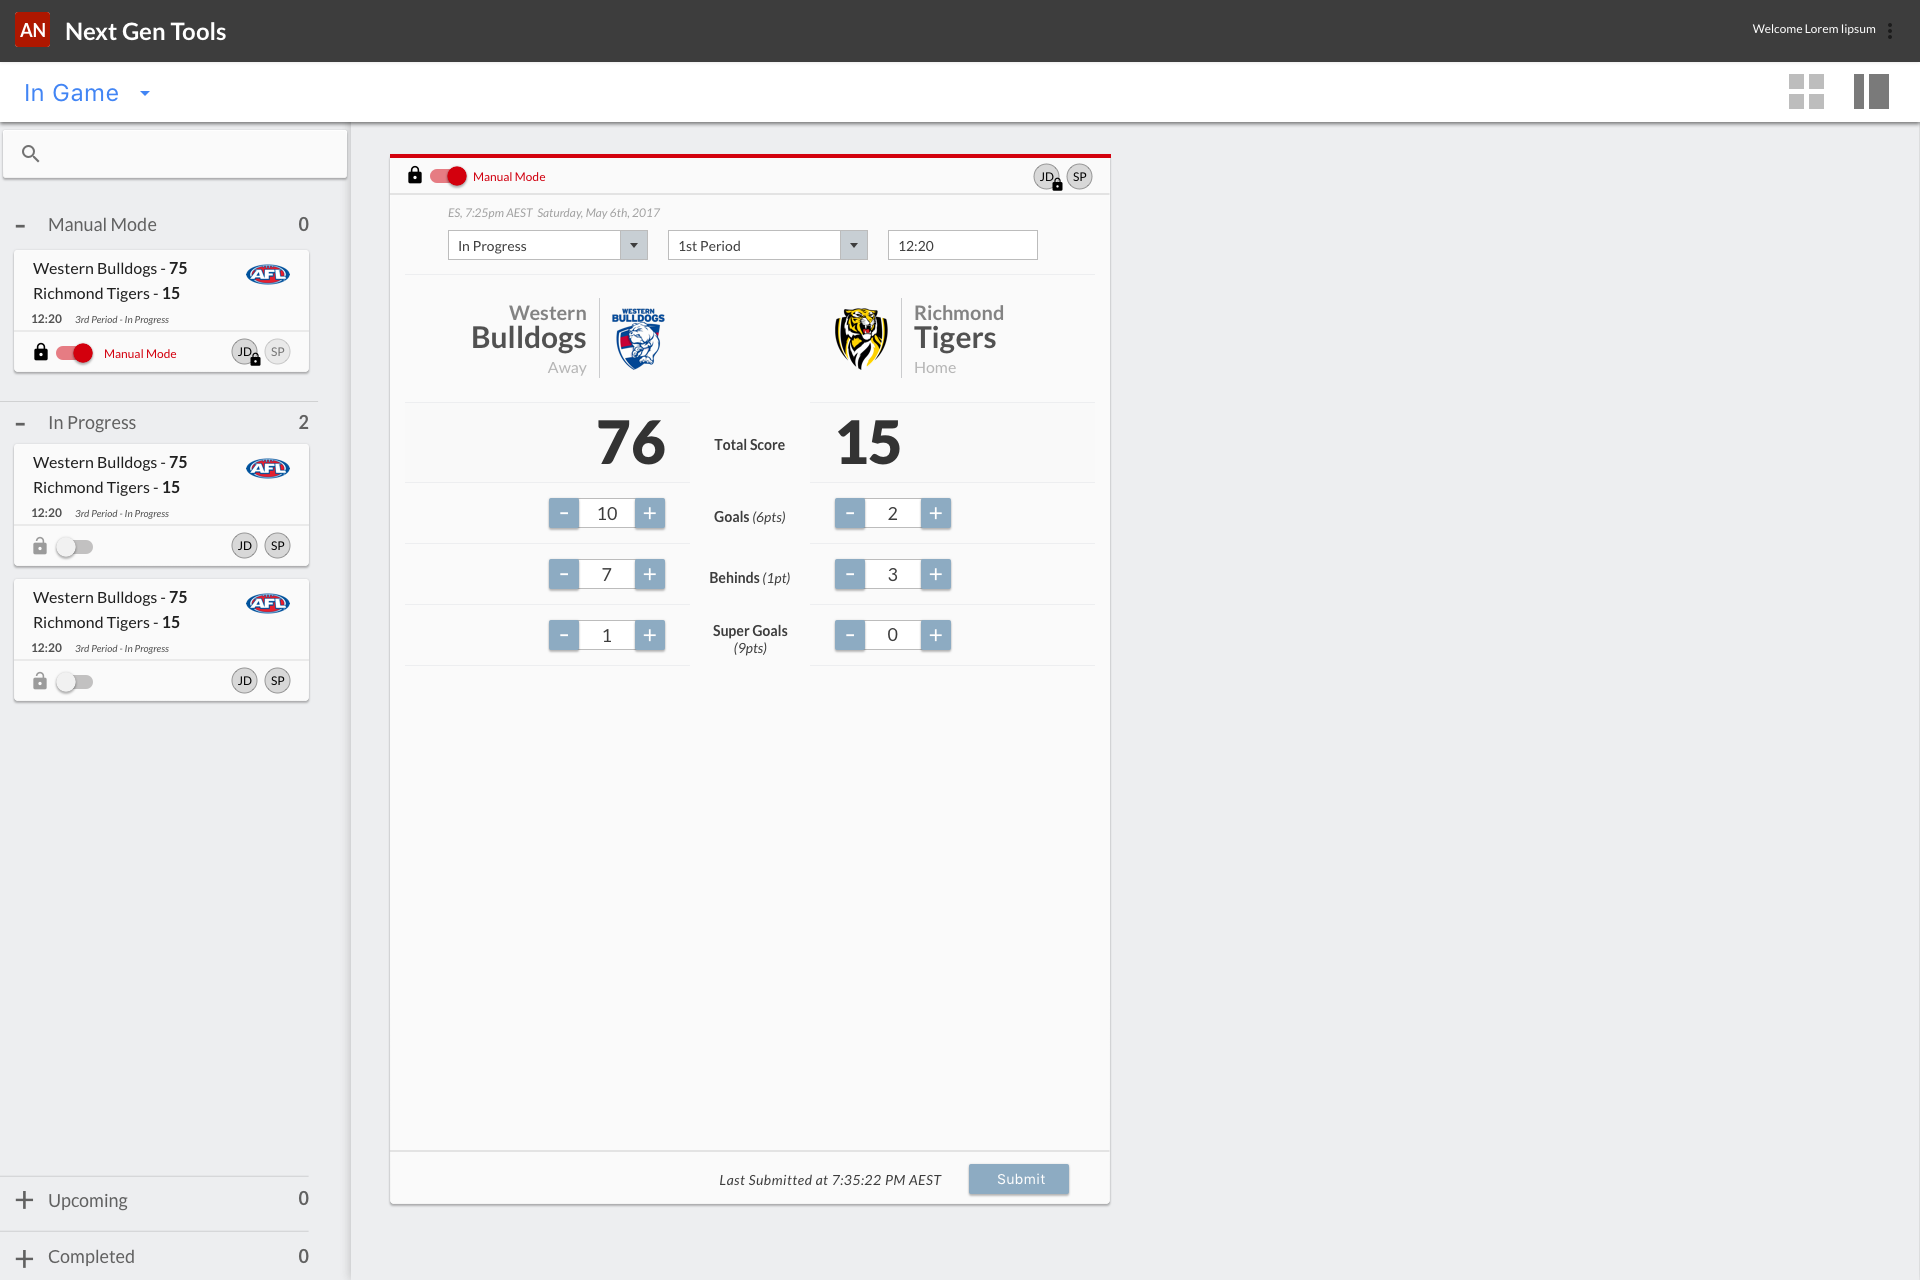
Example of a game in Manual Mode